Rapid Results for New Minority Business Owners
Discover how our powerful solution helps you get customers quickly & achieve success - no tech experience required 😉
25 Statistics on the State of BIPOC-Owned Businesses in 2021
Check out these statistics on BIPOC-owned businesses that show us the importance of supporting minority business owners.

Economic inequality in the United States has experienced a sharp increase in recent decades—especially between racial groups. In fact, a report found that Black and Latinx families are twice as likely to have zero or negative wealth—meaning their debt is higher than the value of their assets—compared to white families. Median white families also have 41 and 22 times more net worth than median Black and Latinx families, respectively.
In the corporate world, there were only four Black and 10 Latinx Fortune 500 CEOs in 2018. It's also worth noting that the industries most impacted by COVID-19, comprise the highest share of minority-owned businesses. Discouraging statistics like these make it apparent that there’s still a long way to go in closing racial economic inequality gaps, and why it’s imperative we support business growth and advancement within communities of color.
Since small businesses are the backbone of our economy, we rounded up 25 striking statistics to help shed a light on the current state of BIPOC-Owned businesses, and identify areas that need the most support. Establishing a successful Black- or minority-owned business comes with unique challenges itself, so we also include some encouraging statistics that help paint a hopeful future.
Minority-Owned Businesses Today

To get an idea of the current state of BIPOC-owned businesses, here are a few statistics with some of the most recent estimates.
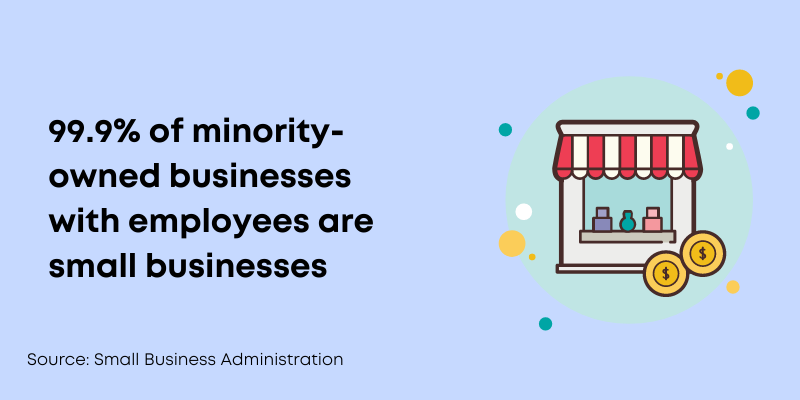
1. 99.9% of minority-owned businesses with employees are small businesses. (SBA)
2. There are 8.2 million minority-owned, non-employer businesses. (U.S. Census Bureau)
3. There are one million minority-owned employer businesses—those with at least one employee. (U.S. Census Bureau)
4. Minority-owned businesses employ 8.7 million people. (SBA)
5. On average, minority-owned businesses make $1.2 million per year in sales. (SBA)
6. The largest industry sector is healthcare and social assistance, comprising 37% of all minority-owned businesses. (U.S Department of Commerce)
7. Minority-owned businesses bring in $1.3 trillion in annual receipts. (SBA)
8. The states with the highest number of BIPOC-owned businesses are California and Texas. (Minority Business Development Agency)
9. In the past two decades, over 80% of minority-owned businesses have been sole proprietorships. (Minority Business Development Agency)
10. Minority-owned businesses are twice as likely to export compared to non-minority-owned businesses. (Minority Business Development Agency)
Areas That Need Improvement

Whether it’s raising capital or hiring labor, below are a few statistics that show where BIPOC-owned businesses need the most support.
11. Although minorities make up 32% of the population, minority business ownership is only 18%. (U.S. Senate Committee on Small Business and Entrepreneurship)
12. Minority-owned businesses have grown by 35%, but their average gross receipts decreased by 16%. (U.S. Senate Committee on Small Business and Entrepreneurship)
13. Black Americans own 2.2% of employer businesses, Hispanics own 5.3%, Indigenous Americans 0.5%, and Asians own 8.9%. (Minority Business Development Agency)
14. Prior to COVID-19, Hispanic- and Black-owned businesses were more likely to be considered "at-risk" or "distressed" than white-owned businesses—and compounded during the pandemic. (McKinsey & Company)
15. 11% of BIPOC-owned businesses have paid employees compared to 22% of non-minority owned businesses. (Minority Business Development Agency)
16. In their first year, 1% of Black-owned businesses obtained loans they applied for compared to 7% of white-owned businesses. (Stanford Institute for Economic Policy Research)
17. On average, big banks approve around 60% of loans applied for by white small-business owners, 50% by Latinx small-business owners, and 29% by Black small-business owners. (McKinsey & Company)
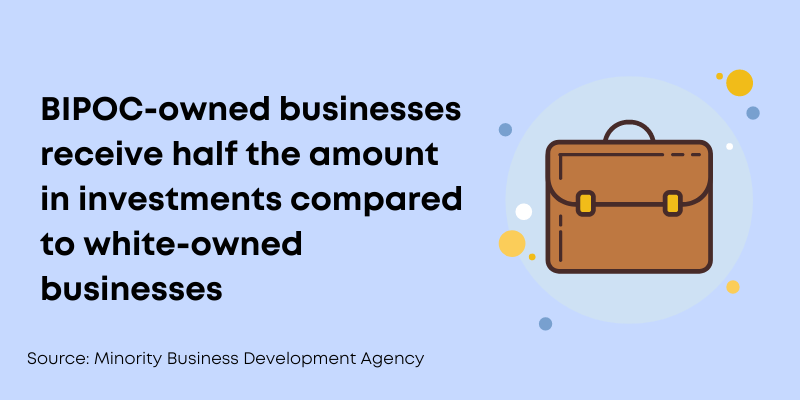
18. Minority-owned businesses receive an average of $3,379 in new equity investments compared to $7,858 by non-minority owned businesses. (Minority Business Development Agency)
Heading in the Right Direction

If the statistics above left you feeling a little deflated, below are some positive numbers that show the benefits of promoting business ownership and growth of wealth within communities of color.
19. 18% of young (under 35) Indigenous Americans are business owners—4% higher than the average. (SBA)
20. 36.1% of all Black-owned businesses are owned by women—higher than any other racial group. (USA Facts)
21. The number of Hispanic-owned businesses increased by 3.0% from 2017. (U.S. Census Bureau)
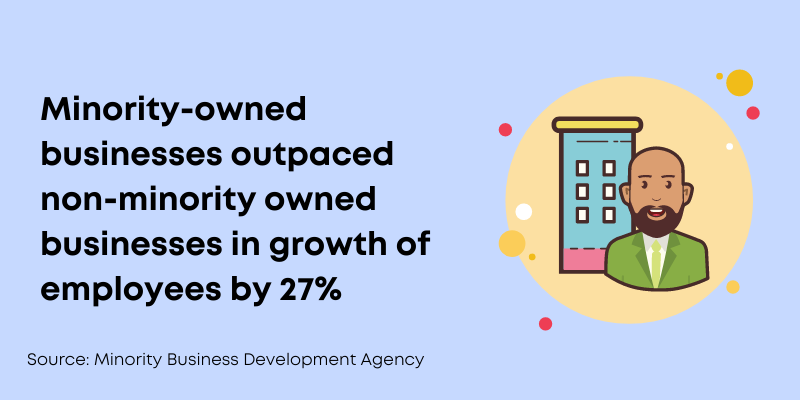
22. Growth in the number of paid employees by minority-owned businesses outpaced non-minority owned businesses by 27%. (Minority Business Development Agency)
23. Asian-owned businesses had the largest gross receipts among minority groups in 2019 totaling $863.3 billion. (U.S. Census Bureau)
24. Minority-owned employer businesses account for over $280 billion in payroll. (SBA)
25. During COVID-19, 40% of minority-owned small businesses added new services to support their communities and employees, compared with 27% of non-minority business owners. (McKinsey & Company)
Whether you’re a business owner or a just a member of your community trying to raise awareness and encourage support for local BIPOC-owned businesses, these statistics are a place to start.
%20(1)%20(1).png?width=340&name=Group%2012%20(2)%20(1)%20(1).png)


